An overview of data preparation in the Studio page is covered in the following sections:
- Data distribution
- Data quality
- Intelligent suggestions
- Search & filter
- Topbar
🔶Data distribution
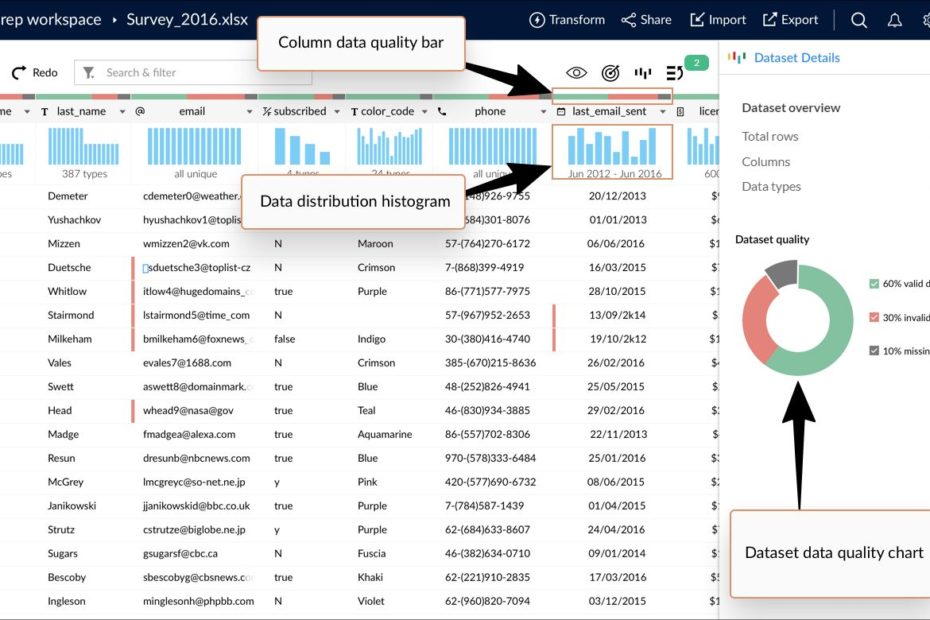
In DataPrep, a histogram is a graphical representation of data distribution and the range of values present in a column. You can spot outliers and anomalies in the data using it. Selecting a bar or a section of the histogram filters the data within the range.
A detailed version of this histogram is also present under Column details, which appears at the bottom when a column is selected.
You can edit the values present in the histogram and have it changed in the entire column. You can also sort the values using the icon.
You can also click the search icon and search values in the histogram using one of the conditions below: - contains
- doesn’t contain
- is
- is not
- begins with
- doesn’t begin with
- ends with
- doesn’t end with
🔶Data quality
DataPrep offers numerous options to measure and improve the quality of your data. Data quality can be assessed from the following areas in the data prep page. - Data quality bar
- Column details section
- Dataset details section
🔶Data quality bar
A data quality bar represents the quality of data in each column. It splits data quality into valid data, invalid data, and missing values, based on data type of the column. Green represents valid data, red represents invalid data, and grey represents the missing values.
When you click on a section, DataPrep filters out appropriate rows so that you can easily deal with invalid or missing values in your dataset. - Hover over the data quality bar to get a quick look at the data quality of a column.
- You can also click on the Show for all columns option to view the data quality of all individual columns.
🔶Column details section
Column details section shows a data summary of each column with its data type, number of unique values in the column, and number of missing, invalid, and valid entries. - The Column details are shown in the bottom panel whenever a column is selected.
- This section has a detailed version of the histogram present at the top of each column. You can edit the values present in the histogram to have it changed in the entire column. You can also sort the values using the icon.
- You can also click the search icon and search values in the histogram using one of the conditions below:
o contains
o doesn’t contain
o is
o is not
o begins with
o doesn’t begin with
o ends with
o doesn’t end with - You can also click the Show more details link to see the expanded view of the details of the selected column. Various aspects of the column such as statistics, outliers, unique values, and data patterns are displayed under this section.
- You can also choose to have the widgets to be shown in the Show more details page from the context menu options next to the column name.